MicSem Publications


Where Have They All Gone? Population Loss in Micronesia
by Francis X. Hezel, SJ
2024 Migration
Where have all the workers gone? That was the question that seemed to rank as one of the paramount concerns at the recent Micronesian Islands Forum meeting, held here on Guam in early June 2024. Where have they all gone? is the refrain commonly sung in the region these days. Everyone is complaining about the shortage of workers. Wendy’s and the other fast-food places on Guam are short-staffed. So are the general stores, supermarkets, and even the radio stations and the daily newspaper, if we can believe the Help Wanted signs that are seen everywhere.
The shortage is even worse when it comes to skilled labor, some of the Forum members complained. There are simply not enough engineers, mechanics, or even school teachers in any of the nation states around the area. This regional shortage of labor is why much of the discussion was directed at education, asking how we might be able to reorganize our schools to provide the training needed for persons with these skills.
But all that might be a distraction from the fundamental problem. Perhaps the real issue is not so much a matter of training as of retaining–that is, retaining the island people who have been educated to handle jobs that they can not take because they have left home to live abroad.
Is the real problem, then, not just a shortage of skilled workers, but a widespread population loss in general? This is certainly the case in Federated States of Micronesia and the Marshalls, even if other parts of the region might not be undergoing the same level of population decline. We may not be able to find simple solutions to a problem that is of concern throughout the entire region, but a closer look at two of the Compact nations might indicate population patterns that have some relevance to the rest of Micronesia.
Overview of FSM and Marshalls
Over the past decade, Federated States of Micronesia has lost a large chunk of its population, according to a 2022 census that still has not been formally released. Its population plummeted from 102,000 to 71,000 over the previous ten years (2012-2022), thus marking a loss of 30 percent of its population. Nearly one out of every three people moved out of the country during that period, if the census figures are correct.[1]
The Marshall Islands recorded a similar plunge in its own population during just about the same period (2011-2021). The number dropped from 53,000 to 42,000, for a 20 percent loss over the decade.[2]
What about Palau, the third of the Compact of Free Association nations? In population change as in so many other matters, Palau has been an outlier among its Micronesian neighbors. In recent years, unlike what we have seen in FSM and the Marshalls, its population has remained remarkably stable. But we can explore the anomaly of Palau later in this paper.[3]
Those who are familiar with the area have come to expect a certain pattern to emigration flows in Micronesia. At first, beginning in the 1960s when US budget increases created more jobs, there was the drift from the outer islands to the town centers for jobs; then, years later, a modest drift to Guam and the US when the Compact allowed free access to the US and its territories. But this new data reveals that emigration is now happening on a much larger scale than ever before. In past years, migration in both FSM and the Marshalls left the resident population stable. It might have been skimming off two or three percent of the population yearly, the same amount by which the island population had normally grown, but not much more than that. Now the real crunch has begun.
Population Shifts Over the Years
To better understand the context for what is happening now, It might be helpful here to look back at the different phases of FSM demography over the years.
Post-war decades: 1958-1980
During the early post-war decades, rapid population growth was the norm throughout the entire region. Between 1958 and 1980, the population of FSM doubled, from 37,000 to 73,000 during a 22-year span. In the Marshall Islands, too, the population more than doubled during the same time span, from 14,000 to 31,000.[4]
Families were growing in size, and with the greatly increased annual budget allotment from the US, there were more employees and higher salaries. Moreover, health care facilities were multiplying and the life span was growing–at least during those early years. With the increase in prosperity came unprecedented population growth. The annual growth rate during this time was between 3 and 3.5 percent.[5]
Transition to Compact: 1980-1994
During the 1980s and early 1990s, as the college education explosion that had begun in the mid-70s continued and island groups in Micronesia prepared for full self-government, the population increase went on, at a lower but still significant rate. This was a time when thousands of islanders were attending college abroad–and perhaps appraising work opportunities overseas with an eye to the future. By 1986, halfway through this period, the Compact of Free Association went into effect, with one of its provisions allowing FSM and Marshallese citizens to freely take up residence in the US. Even so, the FSM population grew from 73,000 to 105,000 (44 percent) between 1980 and 1994. Over nearly the same period, the Marshall Islands population grew from 30,000 to 49,000 (63 percent).[6]
Throughout the whole 36-year period from 1958 to 1994, population growth in Micronesia was enormous by world standards. FSM’s population tripled in size, while the Marshalls’ grew to 350 percent of what it had been.
Early Compact Years: 1994-2010
During the early years of the Compact, population growth fell off greatly due to the increased migration of island people abroad. During this 16-year period, population increase in the Marshalls was minimal (4,000 overall), while FSM showed an actual decline of 3,000. By the end of that period, a migration survey of FSM showed that about 50,000 FSM-born people were already living abroad (in CNMI, Guam and the US).[7] In other words, about one-third of all FSM people had left the islands for a new home. Although no similar survey has been done for the Marshalls, we can assume that the migration pattern was very similar. If that is the case, possibly 25,000 Marshallese would have been living in the US by 2010.
Overall, throughout the early years of the Compact and its free migration provision, we can estimate that between 2,000 and 3,000 people a year were leaving FSM to live abroad. This would be the equivalent of skimming off the annual population growth, which would have amounted to more than 2,000 people if growth rates retained their previous level of about 2 percent a year. We can arrive at similar conclusions regarding the Marshalls, although the migration figures would be halved because of its smaller population size.
Recent Decade: 2010-2020
The recent decline from 2010 to 2022, a 12-year span, showed a loss of 30,000 people–or 30 percent of the resident FSM population. For the first time, then, migration abroad was not just scraping off the excess, but digging deep into the FSM’s basic residential population. This was emigration at a different order of magnitude than the islands had ever experienced before.
The story was much the same in the Marshalls, even if the population loss wasn’t quite as great. During a similar ten-year period (2011-2021). The Marshall Islands lost 10,700 people, or about 20 percent of its population. Significantly, the greatest drop was in the outer atolls, which lost 6,300 people, or 40 percent of its population, during those ten years.[8]
A Closer Look at Recent Population Loss
For years the “outer islands” have been regarded as the most at-risk places for population loss, not for reasons related to climate change and sea-level rise, but because of their limited employment opportunities and their distance from the amenities of modern life. For years most of us had anticipated the eventual emptying of the outer islands in the region. To judge from the recent Marshalls data–FSM figures are not yet available for individual islands–this has begun. Indeed, the outer atolls of the Marshalls (that is, all the atolls other than Majuro and Kwajalein) have lost nearly half their population in the last ten years. Never in post-war history had the remote atolls even come close to such a drop-off.
In the absence of detailed data from the recent census of FSM, we can only make inferences on the population shifts in the outer island there. In Yap the outer islands closely followed the demographic patterns of Yap Proper over the years. Early on (1973-1994) the outer island population grew by 2 percent a year, while more recently (1994-2010) it shrank slightly like much of the FSM. As for the last ten years, then, it’s reasonable to assume that the decline in the Yap Outer Islands has been heavy–most likely about the same as for the entire state: 20 percent.
According to the 2022 provisional census figures, Chuuk State had the biggest loss: 17,000 people, over a third of its population, left in the last ten years. This comes as no surprise since Chuuk has been leading the pack in emigration from the very beginning. Chuuk and Kosrae, two states with the most significant population decline in recent years, showed unusually high unemployment rates (about 25 percent) in the recent census. More startling was Pohnpei’s population loss of 10,000 in the past decade. As the FSM capital, Pohnpei was once thought to be protected from heavy out-migration by its many government jobs and vibrant economy. Evidently, however, there is no longer any part of FSM that is immune to the loss of its people through resettlement abroad.
Emigration from FSM and the Marshalls, has elevated to a new level: it no longer skims off the top of the island population, but it now digs deep into the mass of population. It no longer simply forestalls the need for building new homes; it now results in abandoned houses and deserted villages. For some years now we have been seeing signs of this in certain areas where homes go untended and paths are overgrown. Can we expect much more in the years to come?
The Rest of the Region
Guam
The pattern of population change on Guam is oddly similar to that of FSM and the Marshalls. The early post-war years were a time of rapid growth. During the immediate post-war years (1945-1950) the population leapt from 20,000 to 60,000, partly due to the increase in military personnel on the island. For the next several decades, the population grew rapidly–much as it did in FSM and the Marshalls, but by 2000 the growth had slowed down greatly, as it did in those other island groups in the region. The difference in Guam, however, is that the population did not plummet after 2010, such as we have seen in FSM and the Marshalls. Guam showed a modest drop of a few thousand to 153,000, although this figure was far short of the 168,000 resident population that the government had projected.[9]
Much of the population increase on Guam over the years was the result of rapid growth in the foreign population–first from the US mainland and the Philippines, and then from FSM.[10] By 1990 over half the resident population of Guam was non-Chamorro, and the heavy immigration of FSM people to Guam, reported as close to 20,000, only added to that number.
The steady growth of the resident population of Guam, dependent on a flow of outsiders onto the island, ended twenty years ago. Since 2000, the total island population has dropped slightly even as the steady flow of FSM migrants to the island continued. This suggests that the local population on Guam is diminishing. Even if the annual population growth rate on Guam had been only one percent yearly during those twenty years, the population would have grown by 30,000. If these missing persons are not on Guam, where are they? Can we assume, in the absence of a clear count, that most of them have left the island to live in the US?
Northern Marianas
The population of the newly established Commonwealth of the Northern Marianas grew rapidly from 1980 to the end of the century–from 17,000 to 80.000, its peak, in 2000. Much of the huge population growth can be attributed to commercial build-up in the islands: tourism, followed by an overnight garment industry that employed thousands of Asian workers. Then came a sharp decline, after the closing of the garment factories, to 48,000 ten years later. During the next decade (2010-2020), the population dipped a bit more to 43,000.[11]
The drop in population over the past decade was modest (12 percent) compared with other parts of the region, but the decline in the more remote islands of Tinian and Rota was much sharper. Each of those two islands lost nearly a third of its population during that decade–not very different from the outer island loss in other places.[12]
Palau
The population of Palau, small by regional standards, has exhibited a remarkable consistency over the years. Even more, the indigenous population has shown no significant change over the past four decades. It has remained at about 12,000 during that entire period except for a slight increase during the early 2000s. The total population of Palau, which currently stands at 17,000, has risen and fallen at times, but the big variable has been the foreign population, largely Filipino and other Asian. Foreigners constitute over 5,000 of the total population, nearly one-third of the total.[13]
Population stability has been the hallmark of Palau for decades. At the same time there has been a constant flow of Palauans emigrating to the US. Since 1974, the year in which Pell Grants became available for Micronesians, about 200 Palauans a year have been leaving for the US.[14]
Conclusion
Above we have tried to lay out the population trends in FSM and the Marshalls over the years. While we may not find the same neat pattern in other places, there are some common features that appear elsewhere in the region.
The high population gains once seen everywhere in the region have stopped since the turn of the century. During the second decade of this century there has been an exceptional drain in the population of FSM and the Marshalls, but population loss is also seen in Guam and to a smaller degree in the Northern Marianas.
Over the years the emigration outflow everywhere in the region has been significant. Our data suggest that for FSM and the Marshalls the total number of island migrants is at least equal to and probably now well surpasses the number of current residents. But the same assertion is probably true of Guam, the Northern Marianas and Palau.
FSM and the Marshalls are exceptional in one respect: the migration flow has essentially remained one-way. Neither nation has a sizable inflow of migrants from other places, as is the case in Palau, Guam and the Northern Marianas. But, we should note, the number of immigrants in these places, with the possible exception of Guam, has fallen in the last decade or two. The size of the influx of immigrants is dependent on the twists and turns of the economy, as we might expect.
Overall, then, we should recognize that all part of the region are losing native-born islanders–part of their potential workforce–to migration, some of them to an unprecedented extent. This outward drift has been going on for years now, as most of us know very well. The basic reasons behind it are probably the same as always: the search for better-paying jobs and educational opportunities for the kids. That is a very old story, and there is no reason to believe that it will change anytime soon.
The holes in island population created by the departure of so many local people may answer the question that was heard repeatedly at the Micronesian Island Forum: Where have they all gone? The first step in our response to that question is to understand the extent of the population shift throughout the islands. Absorbing this information may help us anticipate what to expect in the future so that we can plan accordingly.
Francis X. Hezel, SJ
Micronesian Population Shift over the Years
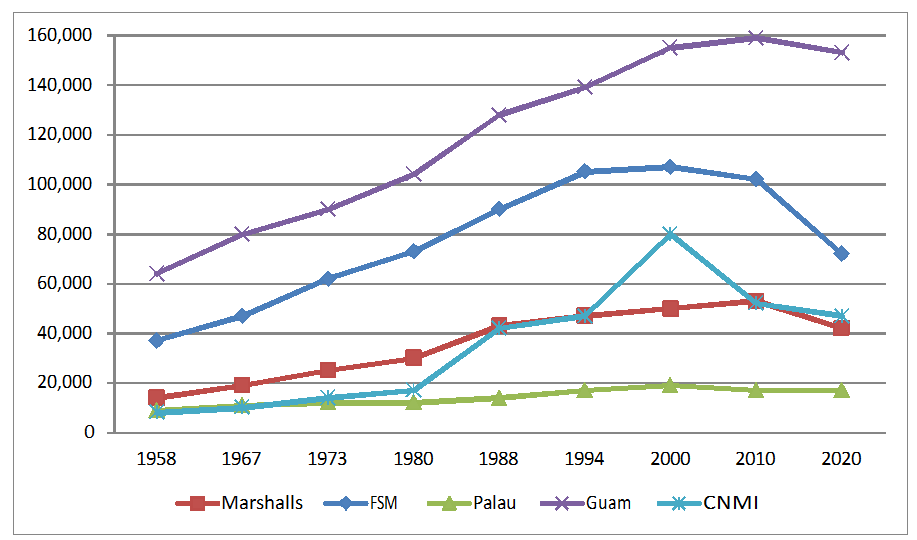
| Year | FSM | Marshalls | Palau | Guam | CNMI |
| 1958 | 37,000 | 14,000 | 9,000 | 64,000 | 8,000 |
| 1967 | 47,000 | 19,000 | 11,000 | 80,000 | 10,000 |
| 1973 | 62,000 | 25,000 | 12,000 | 90,000 | 14,000 |
| 1980 | 73,000 | 30,000 | 12,000 | 104,000 | 17,000 |
| 1988 | 90,000 | 43,000 | 14,000 | 128,000 | 42,000 |
| 1994 | 105,000 | 47,000 | 17,000 | 139,000 | 47,000 |
| 2000 | 107,000 | 50,000 | 19,000 | 155,000 | 80,000 |
| 2010 | 102,000 | 53,000 | 17,000 | 159,000 | 52,000 |
| 2020 | 72,000 | 42,000 | 17,000 | 153,000 | 47,000 |
Notes
[1]. Preliminary Figures for 2022 Census in FSM. These have not yet been formally released by the FSM government.
[2]. Republic of the Marshall Islands, 2021 Census
[3]. Republic of Palau, 2020 Census
[4]. Population figures are from the Trust Territory censuses of 1958, 1967, 1973 and 1980.
[5]. See Francis X. Hezel, The New Shape of Old Island Cultures (Honolulu: University of Hawaii Press 2001): 140.
[6]. FSM census, the first made after independence, was completed in 1994. The census of the Marshall Islands was done in 1988, six years earlier.
[7]. See Francis X. Hezel and Michael J. Levin, “Survey of Federated States of Micronesia Migrants in the United States Including Guam and the Commonwealth of the Mariana Islands” New York, August 2012.
[8]. Republic of the Marshall Islands, 2021 Census
[9]. For early figures on Guam’s population growth, see Jane Underwood, “Population History of Guam,” Micronesica 19 (1973), No. 1: 11-44. Later figures are given in the US decennial reports.
[10]. On later Filipino migration to Guam see Francis X. Hezel, “Deep in the Bloodstream: Historical Ties of the Marianas with the Philippines,” Revista Filipina, Vol 8 (2021), No. 1: 41-51.
[11]. Department of Interior, Population Figures for Island Territories.
[12]. Emmanuel Erediano, “Census: CNMI Population Down 12%,” Guam Daily Post, Nov 1, 2021.
[13]. Census data for Palau between 1986 and 2020 may be found on the Palau Government website: PalauGov.pw
[14]. Unpublished report on Palau emigration done for Micronesian Seminar